Advertising is simple: you spend money to make money. It’s been true for centuries. And while that basic principle is as true now as it’s ever been, the growth of digital advertising has created a seemingly infinite number of ways to evaluate digital advertising results, many of them not tied directly to your company’s bottom line.
But good luck explaining that to your boss, right?
Here’s the thing: in Google Ads alone, there are 106 different default metrics (only 19 of which are related to revenue), 154 different default dimensions, and 37 different default segments. That’s 26 million potential different default data combinations from just one platform (and over 275 million different posts explaining them)! Even if you just focus on the revenue metrics, you’re still looking at 9 million potential different data combinations (and not a single one of them is ROI). And sure, you’ll only ever use maybe 15 to 20 of those combinations, but there are many ways to prove the value of a digital advertising campaign that don’t include revenue numbers at all.
The good news is that it really doesn’t need to be that complicated. To help save you (and your boss) a lot of trouble, we’ve put together a list of the most important metrics and concepts you’ll need to help explain your digital advertising results.
Cost
Here’s one that everyone should understand: cost is the amount of money spent on media purchased. On its own, it maybe isn’t too powerful, but you can use this metric to determine the response to different kinds of messaging in your campaigns, as any platform you advertise with will optimize budget to be spent on campaigns that are meeting their goals.

Impressions
What are they: An impression occurs any time your ad is shown to a user. In the case of display ads, there has historically been a lot of concern around whether an impression is “viewable” or not (meaning whether it actually showed up for a user or was just loaded on a part of the page the user never saw), and as a result, stricter regulations around display ad viewability have been put into place throughout the industry. Virtually any impression you earn today will be a viewable impression.
Why are they important: Impressions mean your audience is being exposed to your brand, so if your goal is to increase awareness of your brand, soften the landing for a product launch or re-engage lapsed users, more impressions are typically a good thing. There is a point when too many impressions mean that your audience develops fatigue towards your message, which is why it’s important to make sure that frequency caps are added to display marketing campaigns.
What else should I talk about: A couple of derivative metrics related to impressions are cost per mille (CPM) and impression share. CPM is the cost required to earn a thousand impressions, and can vary wildly depending on your industry, audience, channels and/or placements. Display ad CPMs are commonly $3 to $5, while search ad CPMs for highly competitive or niche industries can run into the hundreds of dollars or more. Keep in mind when evaluating CPM that the M is important—it’s the cost per thousand impressions, so if the ad in question isn’t generating impressions in the thousands, guard against overreacting to a high CPM.

Impression share is a metric that’s only available in Google Ads, and it’s essentially an analysis of your ad or keyword’s market share. It’s expressed as a percentage, and the higher your impression share, the more penetration that asset has in your market.
Clicks
What are they: Clicks are just that—the number of people who clicked on your ad. Depending on the platform you’re advertising in, clicks can take many different forms. In Facebook, for example, there are 19 different click-related metrics, with four different types of clicks (clicks, ad clicks, outbound clicks, and landing page views), while in Google, there is only one click metric. Many advertisers prefer the Google approach because it’s more straightforward, but there is a merit to Facebook’s tracking as well, because it gives more insight into what type of behavior users take when viewing an ad.
Why are they important: Clicks are important because they impact your website traffic, but also because they provide a barometer for how compelling your message is. If your creative or copy isn’t strong enough to generate frequent clicks, it’s a sign that you may want to test some different assets, but if your ad does get a lot of clicks, it’s a sign that your message is resonating with your audience, and maybe that message should be employed across a wider variety of marketing concepts.
What else should I talk about: The two main derivative metrics related to clicks are click-through rate (CTR) and cost per click (CPC). Click through rate is the ratio of clicks to impressions, expressed as a percentage.

Obviously, you want to generate as many clicks from your impressions as possible, so the higher click-through rate, the better. Conversely, you want to spend as little to earn clicks as possible, so the lower the cost per click–the quotient of cost and clicks–the better.
Conversions
What are they: Where impressions, clicks, and cost have clearly defined meanings, conversions are much more subjective. A conversion is any action you want your audience to take on the site. Usually, these actions are filling out a lead form, signing up for an email list, adding a product to the cart or completing a transaction, but conversions can take myriad other forms, such as viewing a key page, spending a certain amount of time on the site, watching a video or downloading a content offer.
Why are they important: Getting users to take a desired action is the fundamental goal of marketing, so whether that action is purchasing a product or just signing up for an email list, conversions matter. Because digital advertising makes it so much easier to report on and attribute conversions than traditional forms of advertising, virtually all digital advertising is grouped under the category of performance marketing–that is, marketing whose goal is to drive a business result.
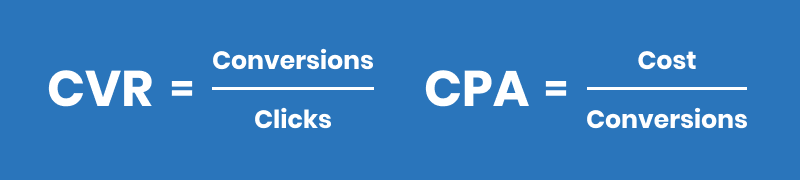
What else should I talk about: Derivative conversion metrics are the same as derivative click metrics: conversion rate (CVR) and cost per action (CPA), sometimes also referred to as cost per acquisition or cost per lead (CPL). Conversion rate is the quotient of conversions and clicks, expressed as a percentage. As with the click metrics, higher conversion rates are stronger and lower costs per action are preferable.
Sales (or Revenue)
What is it: There isn’t much to say about revenue: it’s the money you make, and the digital advertising result your boss cares most about. Formally, a sale is probably a conversion, but we’ve seen “sales” and “revenue” used interchangeably, so we thought it made the most sense to include them together.
If your business isn’t transactional in nature, you may think that you can’t capture this metric, but you can add a conversion value to conversions that come in if it’s important to track revenue from ads in platform. This conversion value is usually an average of all deals closed from the ad channel in question.
Why it’s important: If your digital advertising efforts aren’t producing value, it’s important to know that and to be able to formulate new messages, incorporate new tactics or craft new strategic approaches to your advertising to make sure that you are getting value from it. On the other hand, if your advertising efforts are contributing to massive growth in your business, it’s important that you be able to take credit for that so you can get the recognition you deserve.
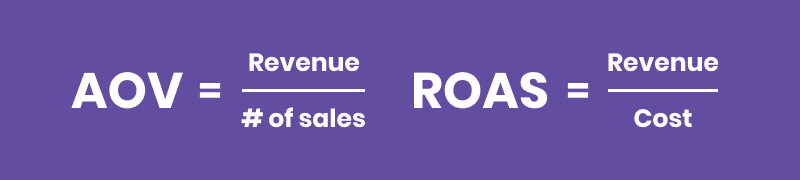
What else should I talk about: Metrics derived from revenue are average order value (AOV) and return on ad spend (ROAS). AOV is revenue divided by sales, and ROAS is revenue divided by spend. The higher either metric is, the stronger your account is performing.
Ad quality
A few other metrics that may be good to explain to your boss don’t come from performance, but may impact how well your ads do.
Quality or Relevance Score is an advertising platforms’ assessment of how strong your assets (keyword/audience) and ads are. Platforms will rate the strength of your content on a scale of 1 to 10, and typically anything below a 6 means that you’ll pay more to earn impressions or clicks than your competition.
Landing page experience is just that, the user experience on the page you’re targeting with your ads. This metric is only available in Google, and there are only three scores: below average, average, and above average. Because the scores are so subjective, it shouldn’t ever be used to evaluate performance, but it can be used to make a case for needing to update or build new assets. Similar metrics are ad relevance (the relationship between the keywords and ads) and expected CTR, which is how likely your ad is to be clicked regardless of position, competition, and ad extensions.
Explaining the intricacies of digital advertising to anyone can be tricky, but now you’ve got the tools to do it. For more on how to prove the value of digital advertising, stay tuned for our upcoming blog post on how to sell advertising results to your boss.